We say that a quantity is decaying exponentially when it decreases at a rate proportional to its current value. Another way to think of the exponential decay is that the time required for the decaying quantity to fall to one half of its initial value is fixed and independent of the initial amount. This time is called "Half-Life". Most common examples of exponentially decaying quantities are the radio active isotopes. For instance, let's take the radio active phosphorus-32: its half-life is about 14 days which means that if we have an initial amount of Phosphorus-32, say Q0, then, after 14 days the amount left will be ½Q0. In the school book there is a small list of radioactive isotopes and their half-life, which we include below.
| Isotope | Half life |
| Carbon-14 | 5730 years |
| Radium-226 | 1600 years |
| Polonium-210 | 138 days |
| Phosphorus-32 | 14 days |
It is really thrilling when the school-algebra meets some applications in the real world, as in the case of the exponential decay. But is it only a piece of information? How could we activate our students to experiment with quantities decaying exponentially and to make them derive the correct rate of decaying? I got my answer from a fellow teacher, Pota Kotarinou, who wrote a wonderful teaching senario titled "The chocolates and the exponential rate law". This was the senario we applied in class with two groups: B2 and B3 on the 4th of April 2016.
The experiment was organised in 7 stages:
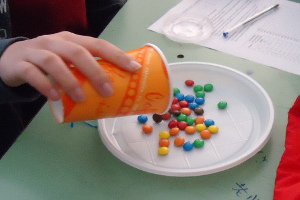
- 1st stage: Each group of students was devided in 3 subgroups of about 6 students each. The small teams got one paper cup with a lid on it -containing exactly 100 chocolates m&ms- and a plastic plate.
- 2nd stage: Each team would shake well the container of the cup and then spread it on the plate. Without reversing the chocolates, they should pick those with no letters on top (as the letters would be on the bottom) and vanish them. You can imagine how tasty was the vanishing procedure!
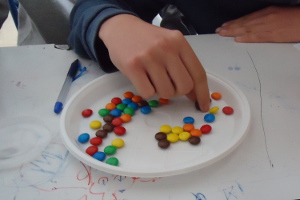
- 3rd stage: They would count the chocolates left after the vanishing stage and would put them back to the cup.
- 4th stage: Stages 2 and 3 would be repeated as many times as it should take to vanish all the chocolates completely.
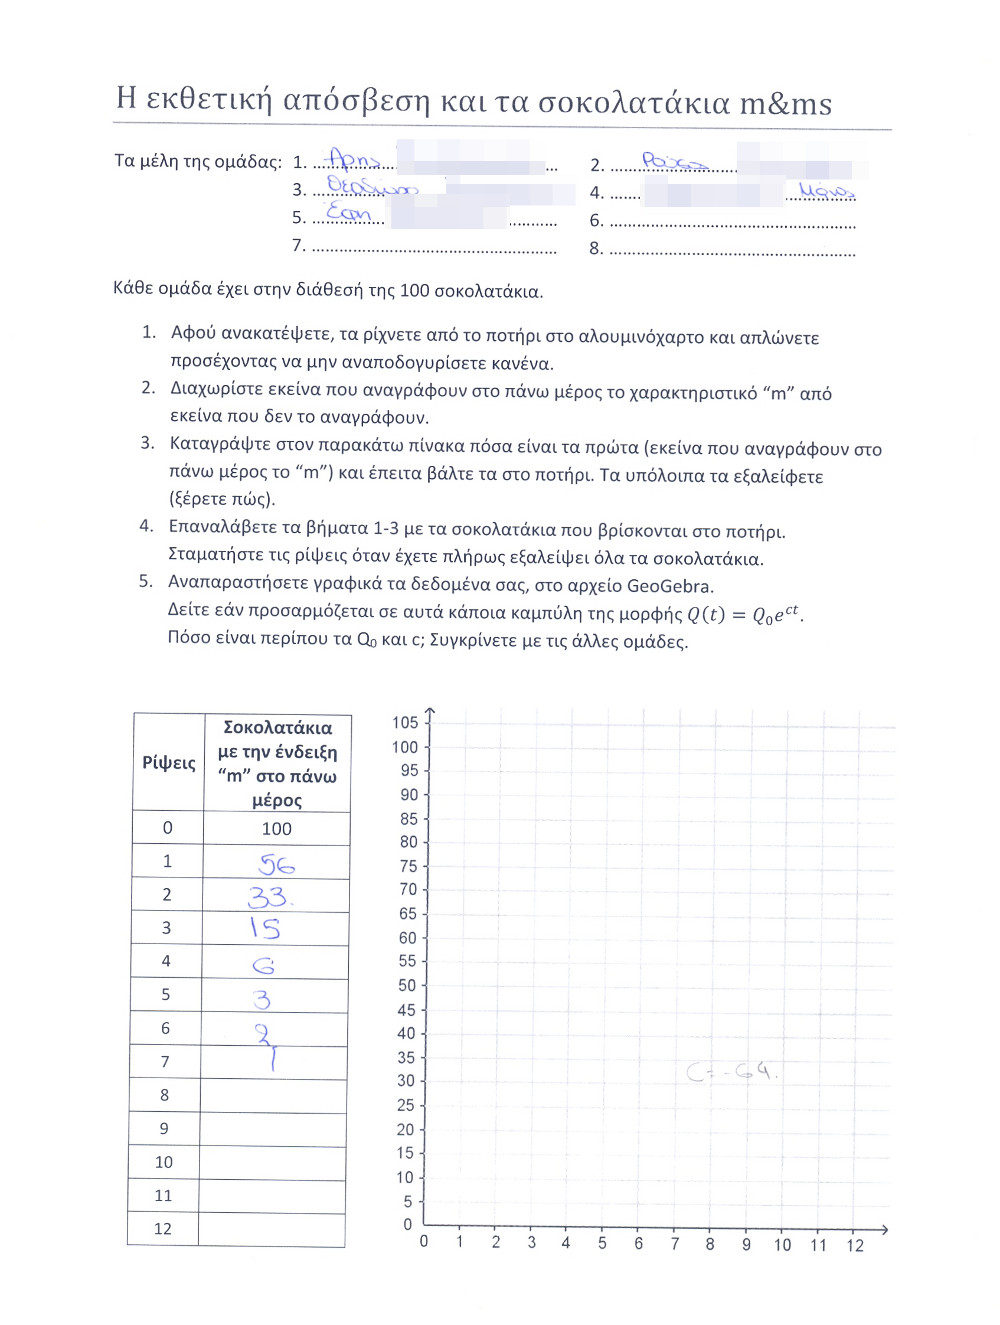
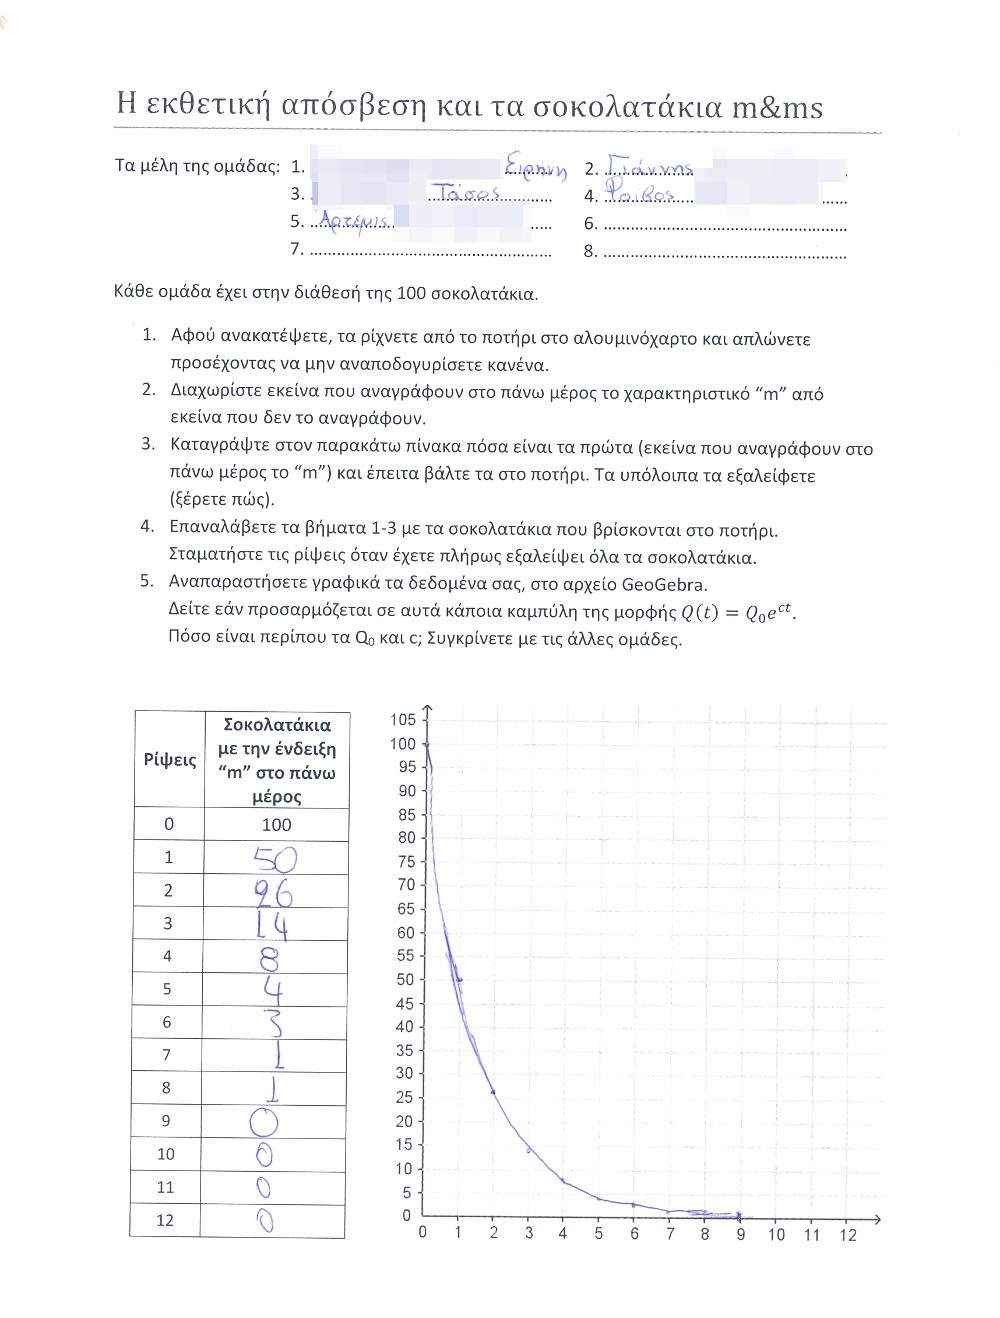
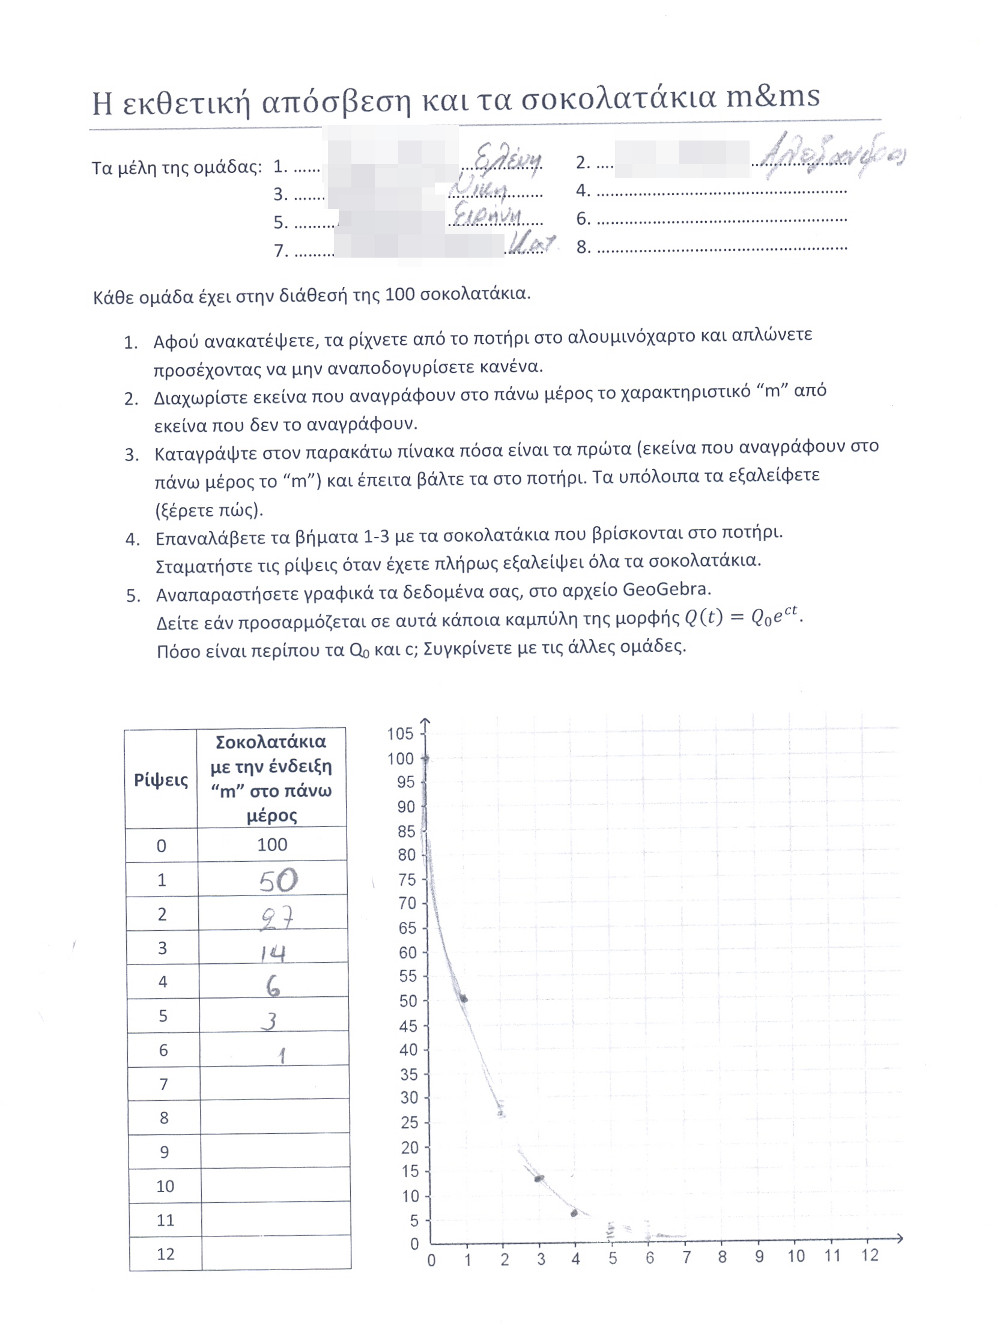
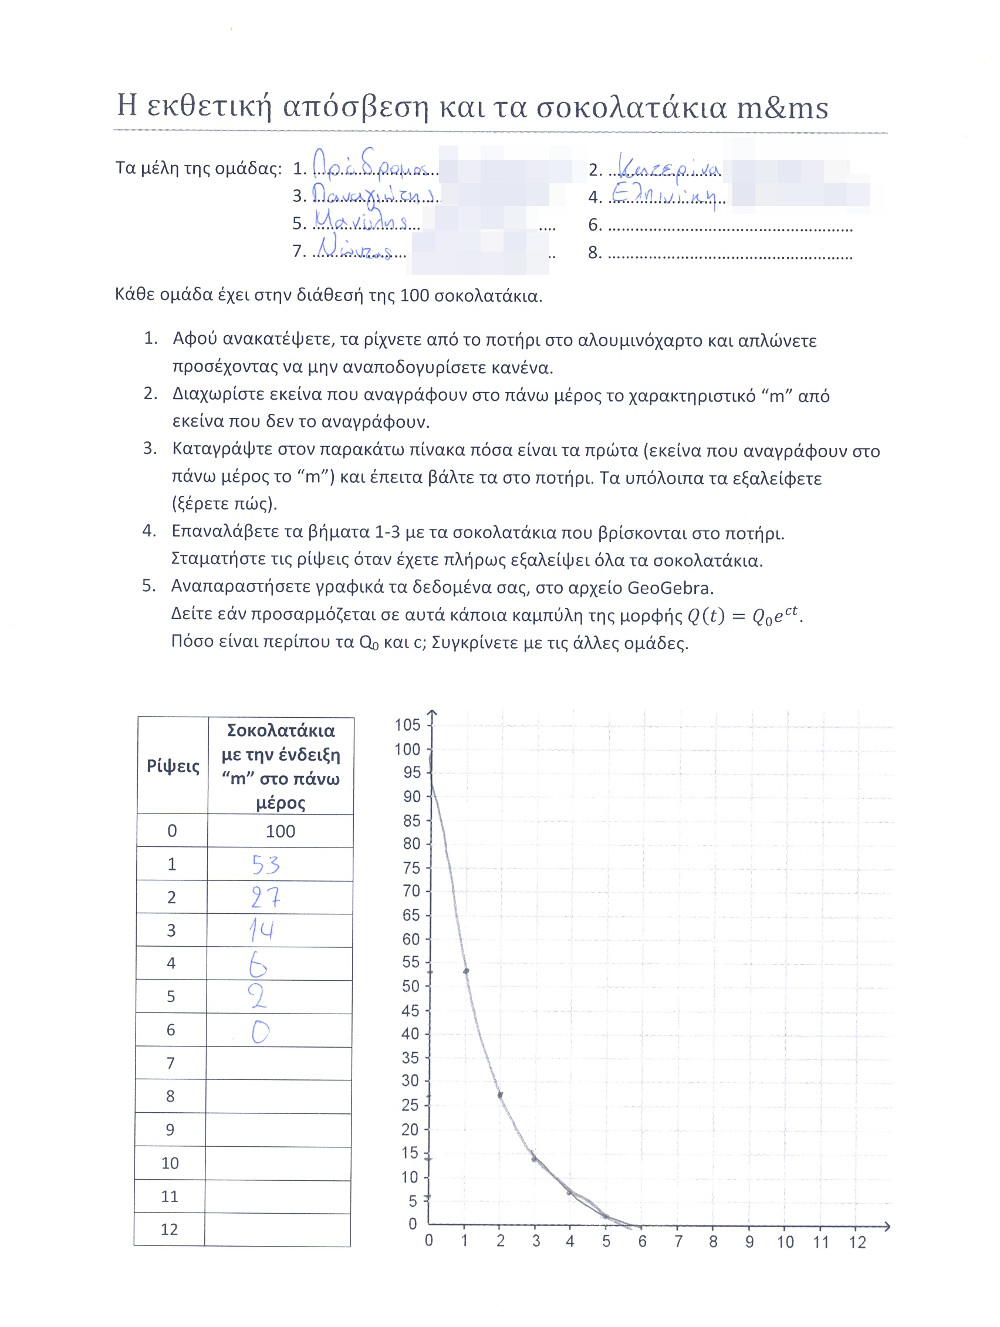
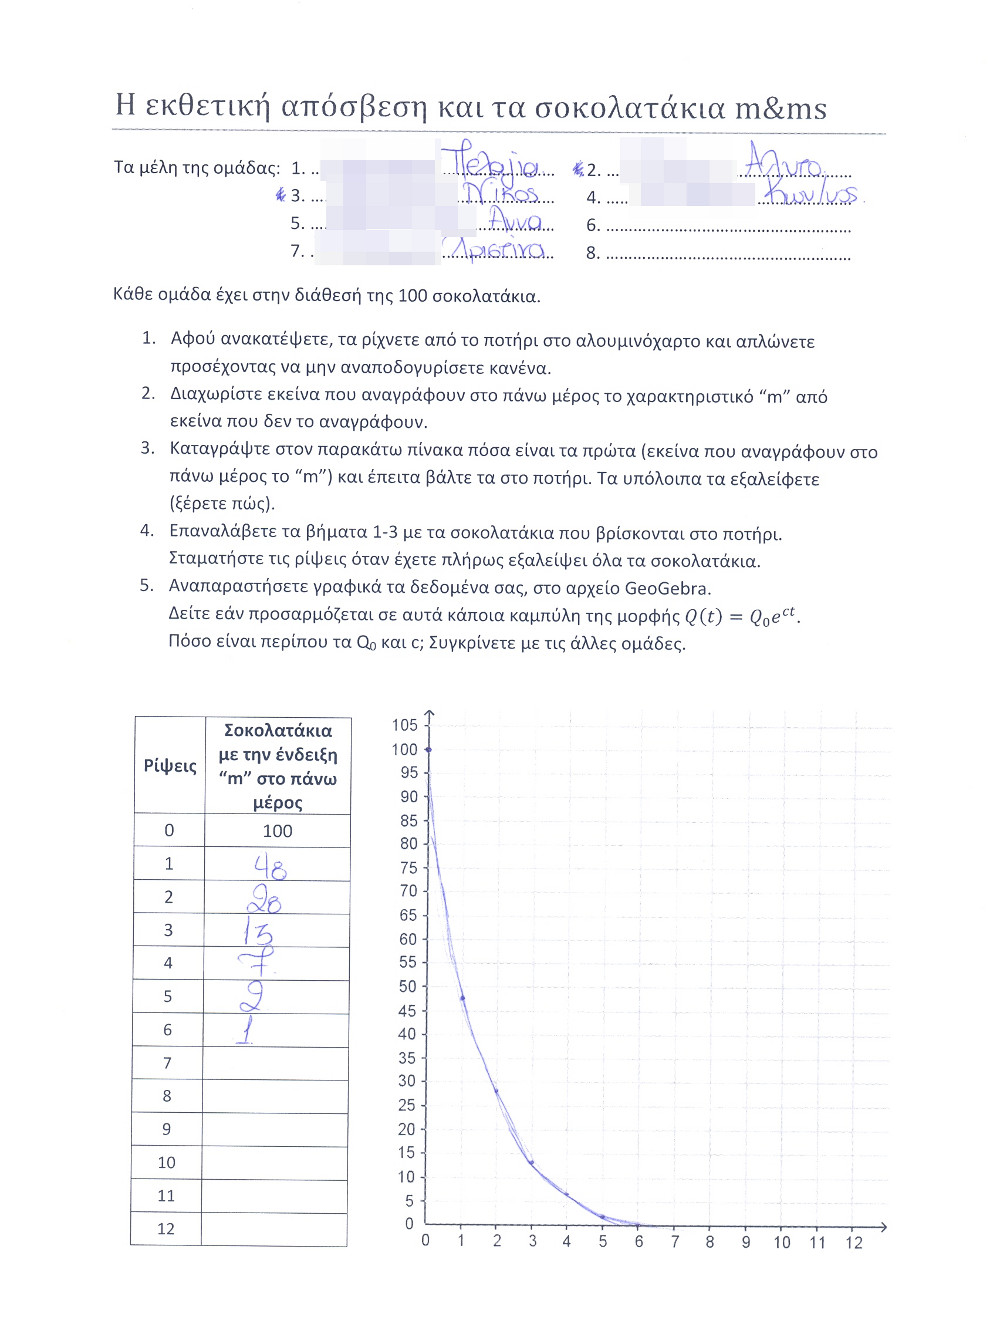
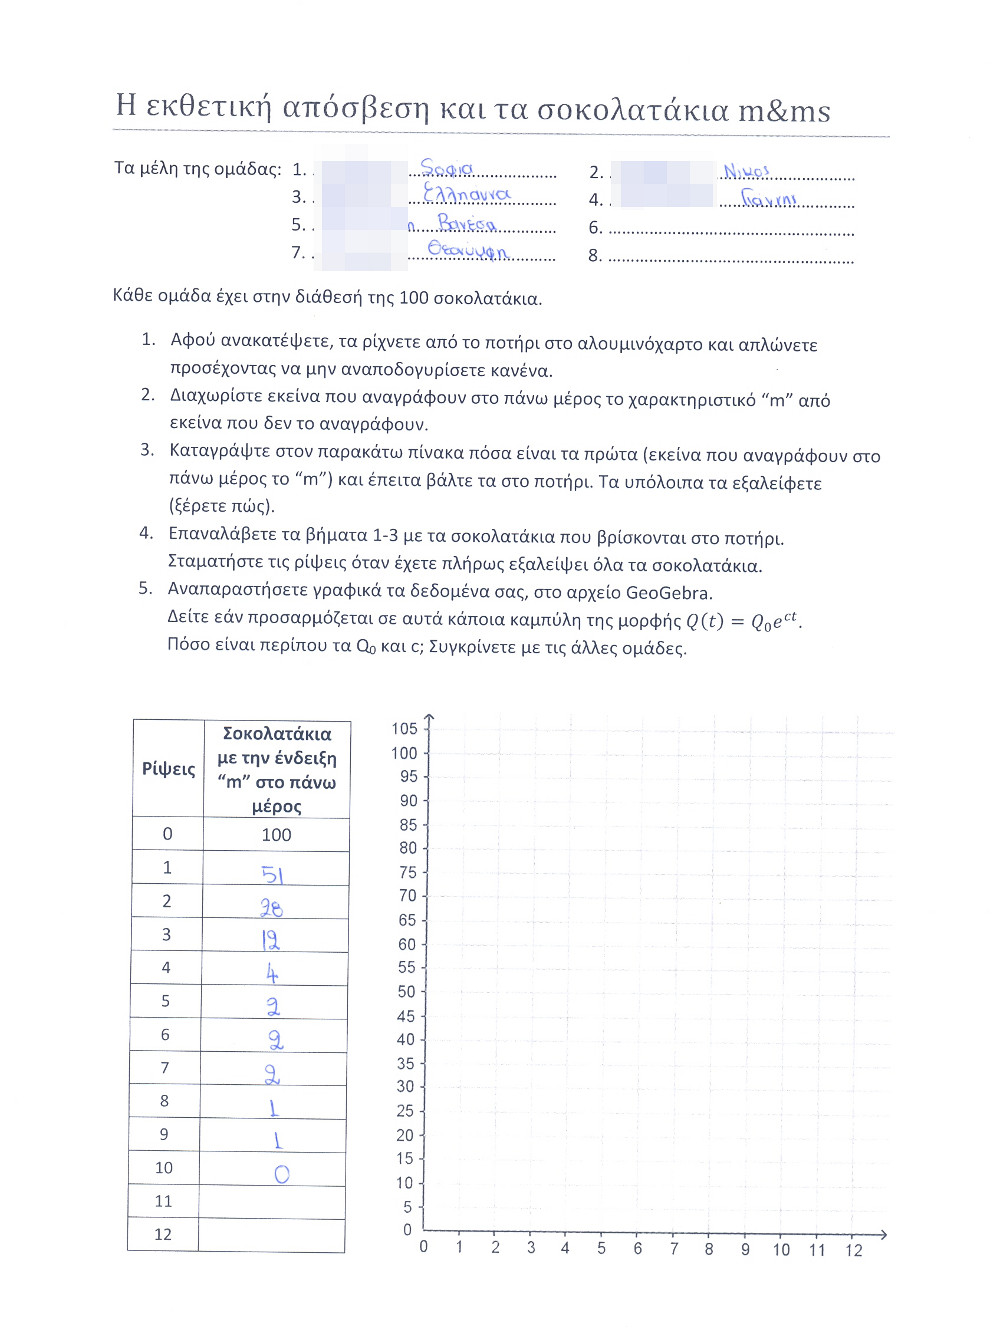
- 5th stage: Each team would complete a table with two columns: the first would number the throws of the chocolates, starting from 0, and the second would be the exact amount of chocolates left after the vanishing proccedure.
- 6th stage: The pairs of numbers (#throw, amount of chocolates) would be plotted on a graph (GeoGebra spreadsheet was used) and then students would try to fit an exponential decay on them. It was really fantastic that in almost all experiments the best fit was achieved by the function Q(t)=100e-0.7t!
- 7th stage: Finally, all teams presented their work to the others.
Find below some descriptive slides and the completed worksheets of each team.
Completed team worksheets
Extra teaching material used for the lesson
- Introductory presentation (pps)
- Three GeoGebra files: The exponential rate (ggb), The m&ms chocolates (ggb), Nautilus (ggb)
- Blank team worksheet (pdf)
- Repository Ifigeneia: The chocolates and the exponential rate law by Pota Kotarinou (published by Giorgos Psycharis)
This site is mastered by Irini Perissinaki iriniper[ατ]sch.gr
Background image by 123RF
 OR
OR


